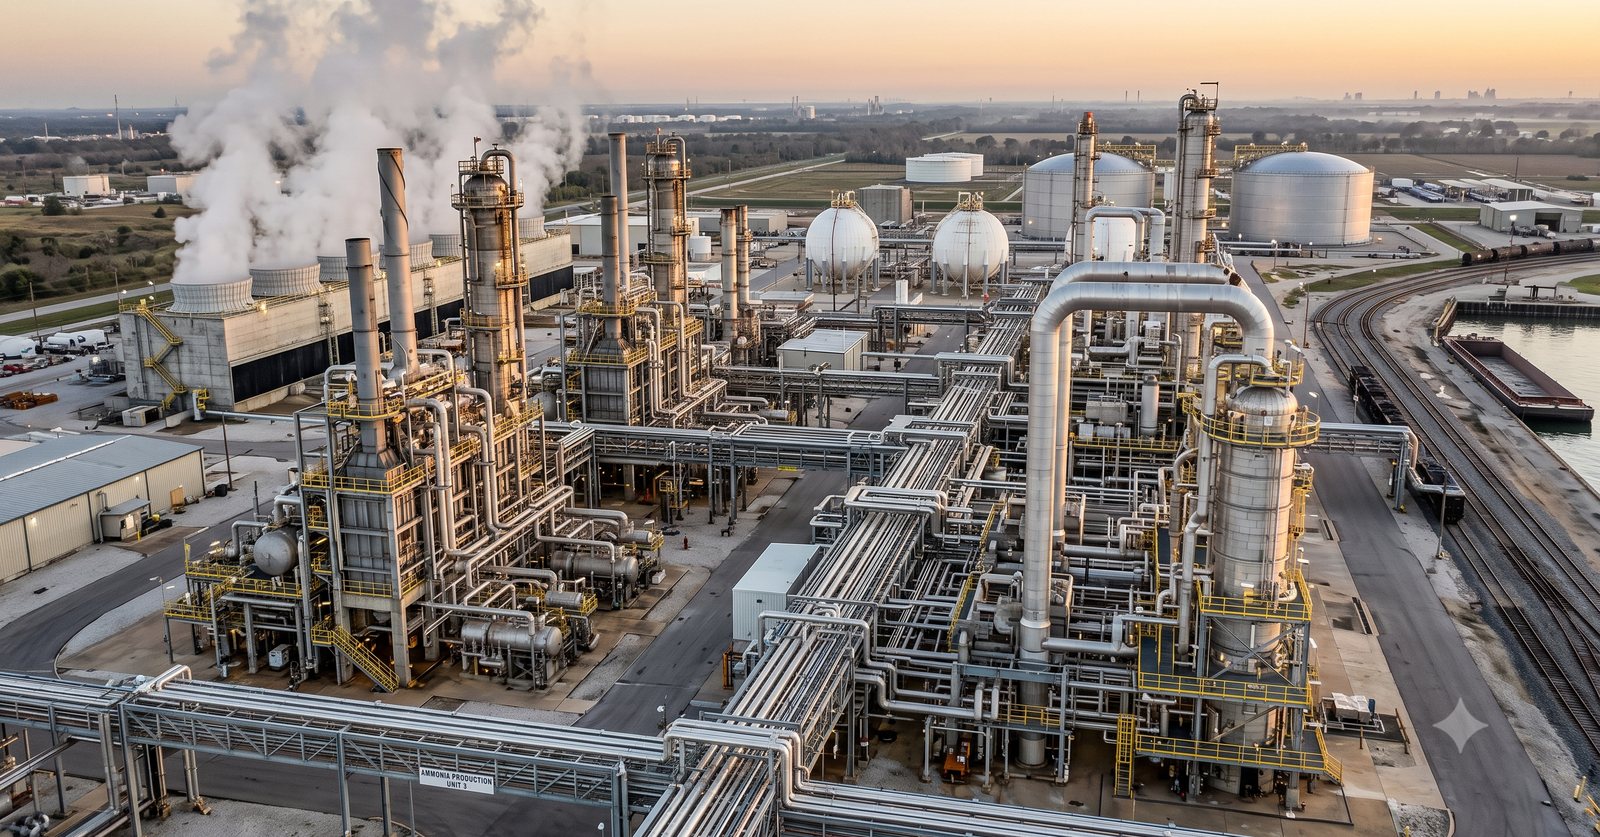
Route of synthesis selection: why the best chemistry is not always the best business strategy. Two companies can make exactly the same molecule by two completely different routes, and both can win. The route that wins is the one that fits the company’s strategy, its feedstock, its assets and its people. Yield is only one part of that. This is an interactive guide for engineers, R&D teams, plant heads, CTOs, promoters and investors: pick a strategy, run the simulators and test your judgement against two real-world case patterns.
Every process engineer learns early how to compare routes: yield, selectivity, raw material consumption per tonne, utilities, number of steps and effluent load. Those are the right questions. But they are the questions for choosing a route. They are not enough for choosing your route.
At the design stage, the hard problem is getting the chemistry to work. At the investment stage, the hard problem is getting the chemistry to fit a strategy that has to survive for 15 to 25 years of feedstock cycles, customer audits, carbon rules and competitors. That is why strategy, not design, is the final boss of process engineering. A design can be good and still lose if the strategy behind it is wrong.
Section 1Strategy is not a one-size-fits-all solution, but it decides the scorecard
Before you decide which product to take up, you need a strategy. Without one, the basket of possible targets is simply too big. Below I have listed ten strategies and compared each one with the lowest unit cost view (the grey outline), which most people treat as the only strategy when entering a new chemistry, whether it is a large-volume commodity molecule or a low-volume specialty. Pick a strategy and see how the priorities for choosing a route of synthesis (ROS) move.
Aggressive growth
Treat the ten profiles as a starting point. You can define your own parameters and weights. The idea is to choose a route that builds risk barriers, a moat that stands for 15 to 20 years and stays aligned with the long-term needs of the business and its customers.
Try switching between Lowest manufacturing cost and Premium product positioning. The molecule is the same and so is the chemistry toolbox, but the scorecard ends up almost reversed. A route that wins one of those reviews can finish last in the other. The chemistry has not changed. The question the company is asking has.
Core thesisThe yield fallacy
In my 14 years in the industry, I have seen many cases where the entry barrier was not set by the cheapest route or the highest yield. It was set by how the first mover framed the problem, and by the surprises that engineering brought along the way. Five patterns keep coming back:
- Technology choices are strategic choices. A route fixes your feedstock, your co-products, your effluent, your safety case and the kind of people you need to hire for the next 20 years. Once the plant is built, that is hard to undo.
- Feedstock selection creates long-term advantages and disadvantages. A route tied to gas behaves differently from one tied to crude. A route that uses a co-product another plant would otherwise have to sell cheaply behaves differently from one that buys on the spot market. The spread you designed around will not be the spread you live with.
- The manufacturing route decides future product expansion. Each intermediate you make in-house is a platform for the next molecule. Each one you buy is a door you have left closed.
- Existing infrastructure often matters more than theoretical process economics. A brownfield route using an existing tank farm, hydrogen header, incinerator and approvals can beat a greenfield route with 8% better yield. It can also be commissioned two years earlier.
- Organisations can only run what they can absorb. A high-yield route that needs cryogenic lithiation, a new type of hazard study and a skill set you do not have will not reach nameplate yield in year one. It may not reach it in year three.
The same molecule can be made successfully by two companies on two different routes, because each route fits a different strategy.
FrameworkThe route selection framework
Route selection has five families of decision variables. Most organisations score the first two carefully and assume the last three will be fine. Hover over or tap any factor to see what it means and which other factors it pulls against.
How the families interact
No variable is independent. The heat map shows how strongly each family pulls against, or reinforces, the others in typical route decisions. Hover over a cell for the usual way that pair plays out on a real project.
Two patterns stand out. Technical and ESG factors usually reinforce each other: better selectivity means less waste, less solvent to recover and less energy per tonne. Strategic and economic factors usually pull against each other: backward integration, platform intermediates and licensing optionality all cost capex today for value that arrives later, often beyond the period a standard IRR model looks at. That tension is where route decisions are won and lost, and it is why the next section matters.

LeadershipTechnical leadership at the strategy junction
Strategy teams are good at markets, customers and capital. What they often cannot see is how a chemistry choice limits their options later. When route selection is decided entirely in a strategy deck, a few predictable mistakes appear:
- The route is chosen on a single feedstock price. Nobody has asked what happens to the spread when the feed moves from being gas-linked to being crude-linked.
- The route is chosen for today’s molecule. Nobody has asked which molecules the intermediates would unlock in five years.
- Scale-up risk is treated as a line in the contingency budget, when it is really a question of whether the plant ramps up in 6 months or 36.
- Integration value (a hydrogen stream going to flare, a co-product being sold cheaply, an existing incinerator with spare capacity) never gets into the model because nobody on the team knows it exists.
Technical leaders who sit where strategy is made, rather than downstream of it, turn business intent into technology choices. In practice they judge five things that nobody else in the room can:
Feedstock optionality
Can the route accept a second feed, or a second grade of the same feed, without a rebuild? A route with two possible feeds can switch when prices move. A route with one is exposed to it.
Future platform potential
Which intermediates does the route make in-house, and how many future molecules can be built on them?
Integration opportunities
Which utilities, co-products, waste streams and approvals can be shared with existing assets, and what are they worth per tonne?
Scale-up risk
How far does the route sit from what the organisation has already scaled up? That includes heat removal, solids handling, exotherms and metallurgy.
Long-term competitiveness
Where will this route sit on the industry cost curve in year 10, once competitors have learned the chemistry and carbon has a price?
Can the technical team state the strategy?
If the process head cannot explain in two sentences why the company is building this plant, the route will be optimised for the wrong objective.
How the pattern shows up across the industry
These are generic patterns seen across the sector. No specific company or project is described.
| Segment | Where “best chemistry” and “best strategy” part ways | What technical leadership adds |
|---|---|---|
| Petrochemicals | An on-purpose propylene unit gives one product and a simple story. A cracker-linked route gives a slate of co-products that is harder to manage but can become a platform for derivatives. | Values co-product streams as future feedstocks, not just by-products to be sold. |
| Fluorochemicals | Buying a fluorinated intermediate is faster and cheaper to start. Backward integration into the fluorine chain costs more capex but opens a family of downstream molecules and protects supply. | Maps which in-house intermediates unlock which future fluoro-specialties, and whether the team can run HF safely at scale. |
| Agrochemicals | The shortest route to an active ingredient may depend on a single-use intermediate. A slightly longer route through a common intermediate can serve three or four products and give freedom to operate around process patents. | Brings intellectual property (IP) and platform thinking into route choice before the first batch record is written. |
| Specialty chemicals | A bio-based or “cleaner” route can cost more and yield less, but it wins specifications and shelf space with brand-owner customers that a cheaper route cannot. | Puts a number on the value of customer perception and certification against the lower yield. |
| Pharmaceuticals | Once a route is filed in a regulatory dossier, changing it means a variation filing and customer requalification. A reagent that creates mutagenic-impurity concerns can lock in years of analytical burden. | Treats route choice at filing as a decade-long commitment and designs the impurity profile deliberately. |
Benchmark your organisation: route-strategy maturity
Organisations move through four levels of maturity in how they connect technology and strategy. Answer eight statements honestly and the model places you on the ladder, with the next moves for your level.
Case study 1Isopropyl alcohol (IPA): one molecule, two value chains
Isopropyl alcohol is a commodity solvent, a pharmaceutical process solvent and a disinfectant base. The molecule is the same whoever makes it. The value chains behind it are not. Two routes dominate the argument:
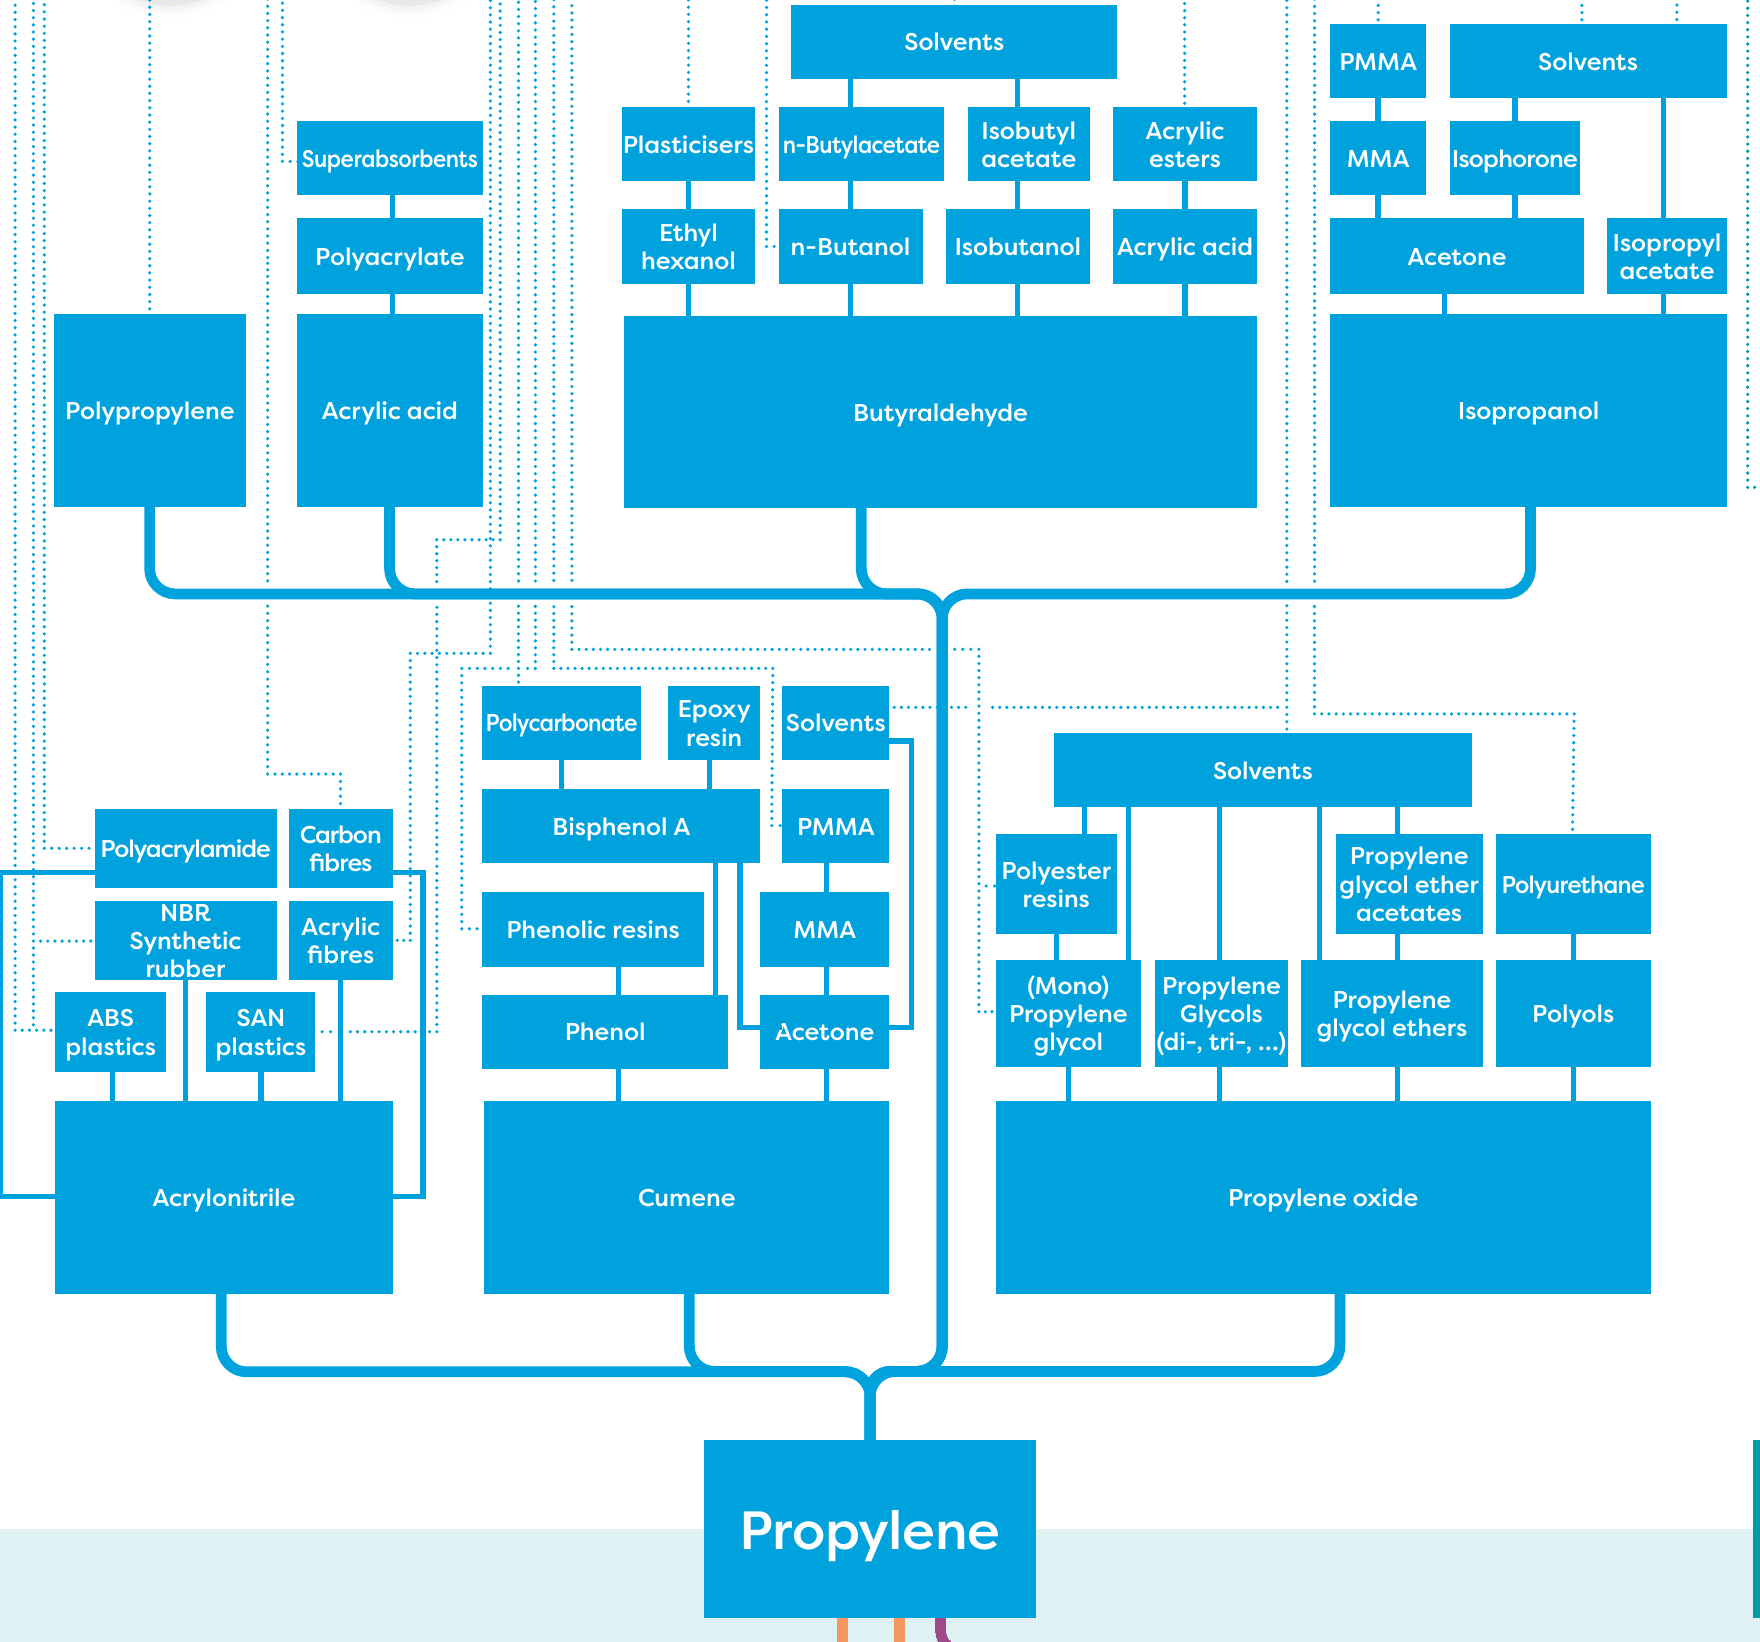
Animated flow: Route A (blue) hydrates propylene directly. Route B (green) makes IPA by hydrogenating acetone, which is a co-product of the cumene-to-phenol process. Hover over any unit for notes.
Propylene hydration, using refinery or cracker propylene
- Petrochemical integration: propylene arrives over the fence
- High purity and a well-known impurity profile
- Strong acceptance by pharmaceutical customers
- Feedstock tied to the refinery or cracker; propylene availability decides run rates
- Gas-linked energy and crude-linked propylene both feed into cost
- Higher standalone capex
Cumene → phenol + acetone → IPA (acetone hydrogenation)
- Turns surplus acetone into a product with better demand
- Low incremental capex when added to a phenol complex
- Protects the phenol plant’s run rate when acetone is long
- Crude-linked economics through benzene and propylene
- Profitability depends on the phenol premium and the acetone balance
- Different customers and margin structure; pharma qualification takes longer
Neither route is better in every market. The better route depends on crude price, natural gas price, the phenol premium, acetone demand and pharmaceutical demand, and all five move independently. That is the point of the simulator below.
What the simulator teaches
- Route A wins when propylene is plentiful and pharma demand is strong. Its purity and pharma acceptance earn a premium that Route B cannot fully capture.
- Route B wins in an acetone glut. When the phenol premium is high, phenol plants run hard and acetone piles up. For a phenol producer, IPA is then a balancing asset. Its main value is keeping the phenol plant full, not the IPA margin.
- The gap between the routes moves more with markets than with engineering. Getting 2% more yield from either reactor shifts the margin less than a normal year’s swing in the acetone balance.
Case study 2 · Looking back3-TFMAP: why the first entrant and the later entrant chose different routes
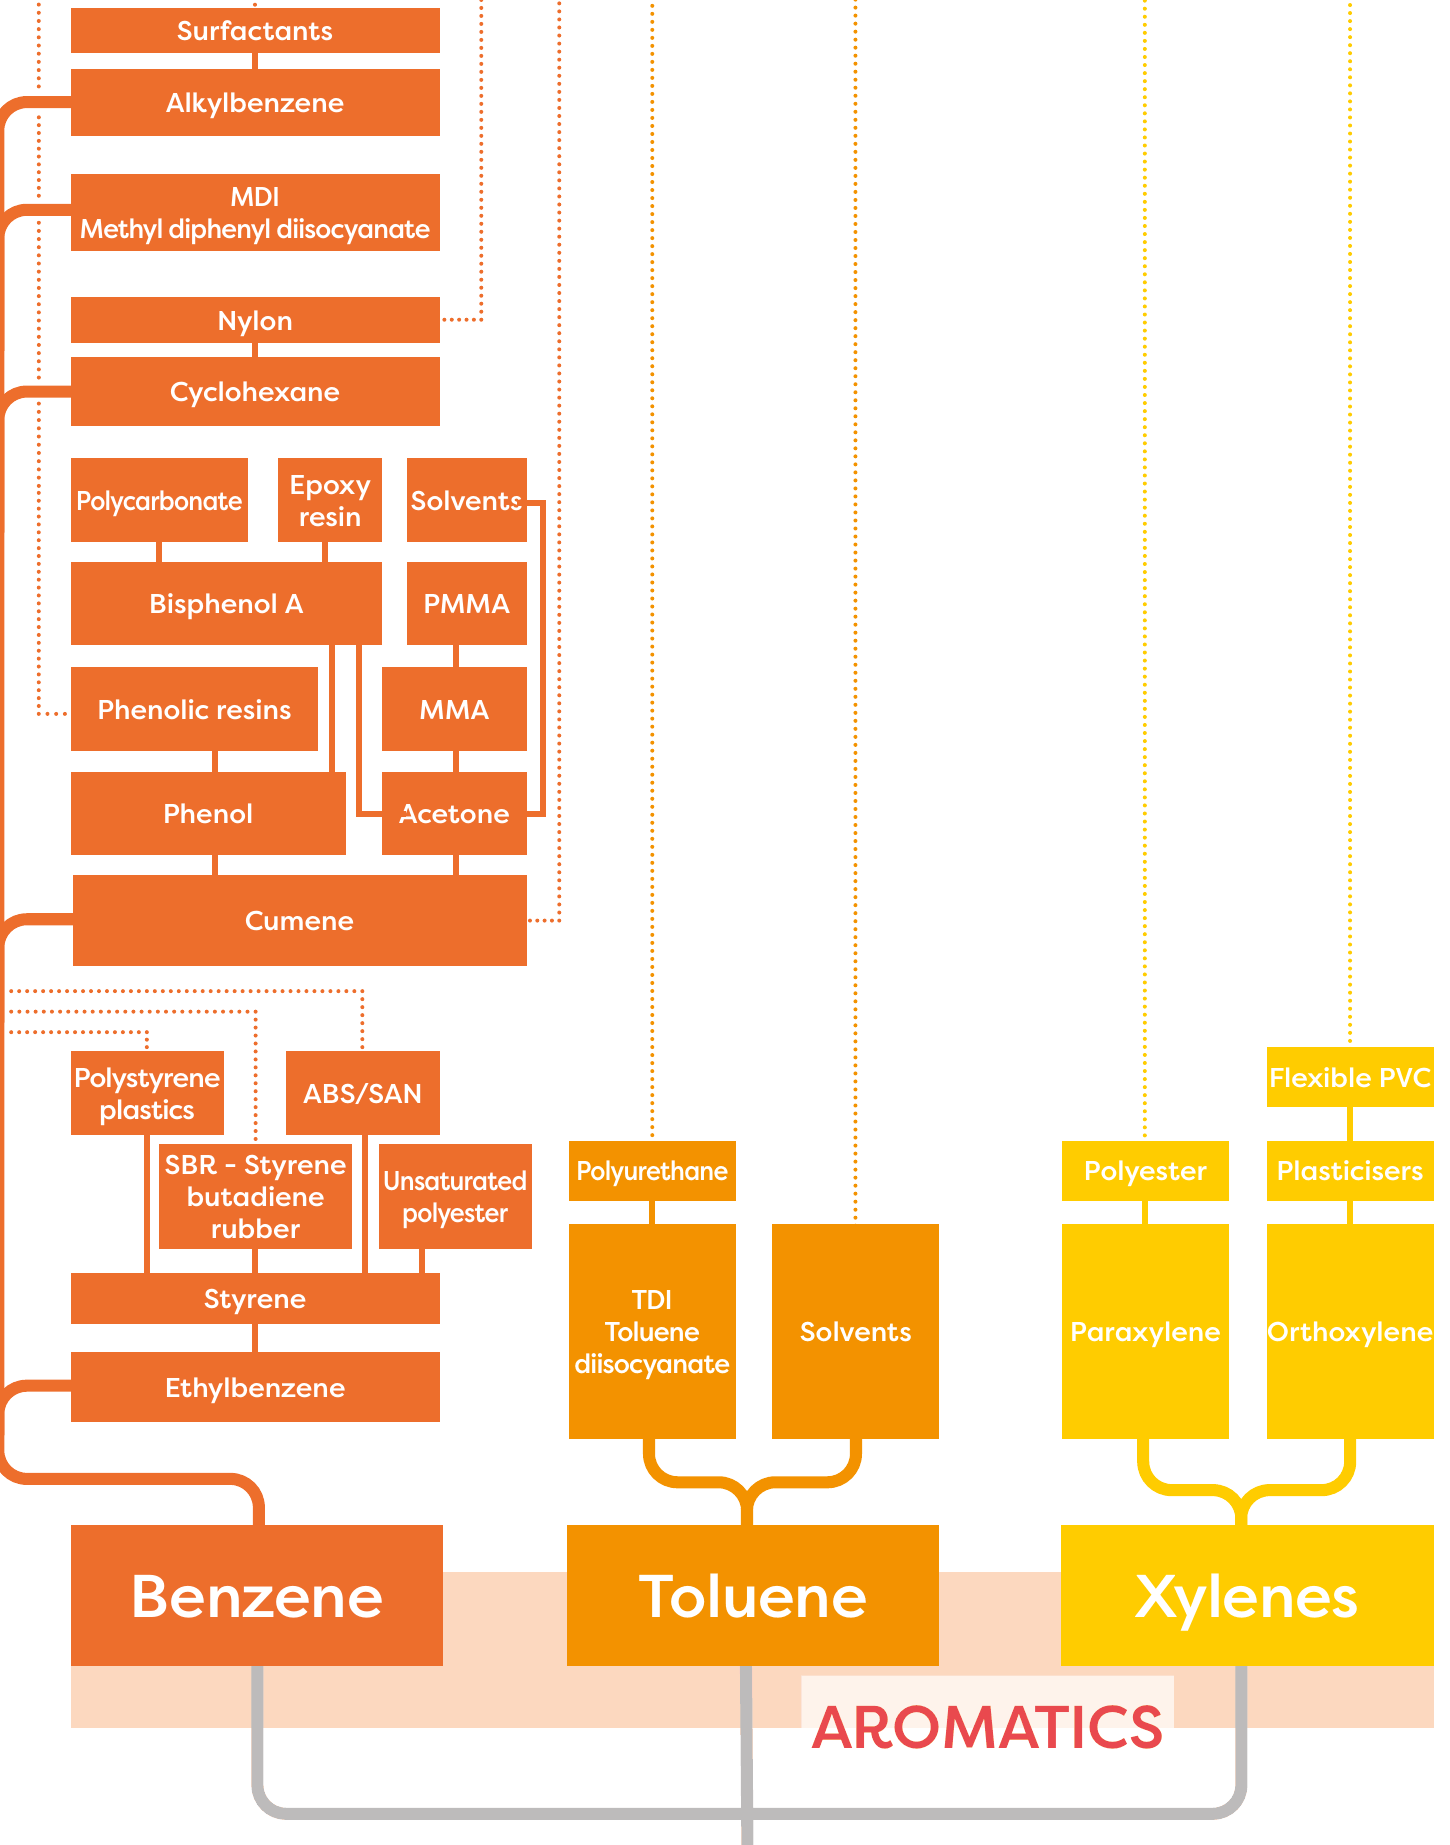
3-TFMAP is a fluorinated aromatic ketone used as a key intermediate in crop protection. It is a useful case to look back on because the market developed in a clear sequence. The first producer and a later producer made the same molecule by different routes, and both decisions were right. This is a look back at how the sector developed, written at the level of route families and strategy. It does not give process details, and no specific company is described.
Toluene-derived route (through the benzotrifluoride chain)
- Higher overall yield (about 78% in this illustration)
- Faster to commercialise, with familiar unit operations
- Lower raw material cost per kg
- Handling complexity across the aromatic chain
- Isomer and trace-aromatic impurity profile that sensitive customers look at closely
Non-toluene route
- A different impurity fingerprint that supports premium positioning
- Easier acceptance in sensitive, regulated applications
- A product that stands apart in a crowded supplier list
- Lower overall yield (about 62%)
- More complex chemistry and a longer development cycle
How it played out
Technology managementWhy AI changes the game but does not replace judgement
AI is already useful in route selection. Retrosynthesis tools suggest routes that no one on the team would have drawn. Machine-learning models predict costs from structure and step count. Forecasting models turn feedstock histories into ranges of possible prices. This speeds up the screening stage a great deal.
AI improves
- Route screening: hundreds of candidate routes ranked by step count, reagent availability and hazard flags
- Cost prediction: early-stage cost of goods from structure and route descriptors
- Supply chain modelling: supplier concentration and single-source risk
- Feedstock forecasting: price ranges instead of a single price
- Process optimisation: design of experiments, soft sensors and advanced control
AI cannot fully predict
- Customer behaviour: whether a key customer will requalify, or will pay for a cleaner impurity fingerprint
- Regulatory shifts: a solvent restriction or a new impurity guideline
- Strategic fit: whether this route supports the company’s next three moves
- Capability gaps: whether your team can run this chemistry safely at 3 a.m.
- Execution quality: how well your project organisation delivers
Sort it: AI strength or human judgement?
For each task, decide where the weight of the decision should sit. Then see the reasoning.
Advanced toolRoute Selection Digital Twin
This tool puts the whole framework together. Define your product, route family, scale, market and constraints. The model returns five scores and tests them against four stress scenarios. Pin up to three configurations to compare them side by side. It is a screening model: it tells you which questions matter for your case. It does not replace a feasibility study.
| Scenario | Route fitness | Strategic alignment | Technology risk | Market resilience | Expansion potential | Est. capex |
|---|
Decision practiceWould you build this plant?
Three proposals are on the table at an investment committee. Make your call before you read the review.
Route strategy decision tree
A quick way to find the route archetype to test first. Answer three questions.
Test yourselfCTO challenge
Six questions, and each one has a trap. Your score shows at the end.
Take-awayA practical framework you can use on Monday
Before any route goes to capital approval, it should pass a seven-question review, with both a technical owner and a commercial owner signing each answer:
- Strategy fit. Which of the ten strategies above is this plant meant to serve, and does the route’s priority profile match it?
- Feedstock under stress. What is the margin at the 10th and 90th percentile of feed prices, not just the base case? Is there a second feed option?
- Integration value. Which utilities, co-products, waste streams and approvals does the route share with existing assets, and has that value been counted?
- Platform value. Which intermediates does the route make in-house, and which future molecules do they unlock?
- Absorption capability. Has this organisation scaled up this kind of chemistry before? If not, what is the realistic ramp-up curve, and who will be recruited?
- Customer and regulatory lock-in. What impurity fingerprint does the route produce, who will audit it, and how hard is it to change after filing?
- Year-10 cost curve. Where will this route sit once competitors have learned the chemistry and carbon has a price?
A weighted scorecard for two candidate routes across all five factor families (27 factors), with editable weights and scores and totals that calculate automatically. It opens in Excel or Google Sheets.
Frequently asked questions
What is route of synthesis selection?
Route of synthesis selection is the choice of which chemical pathway, feedstock and sequence of process steps to use to make a molecule at commercial scale. It sets raw materials, co-products, capex, safety case, impurity profile and future expansion options, so it is a business decision as much as a chemistry decision.
Why is the highest-yield route not always the best?
Yield is measured at fixed prices on one flowsheet. Over a plant’s 15 to 25 year life, feedstock exposure, integration with existing assets, customer acceptance, regulatory lock-in, scale-up risk and platform value often decide profitability more than a few percentage points of yield.
What factors should a route selection framework include?
Five families: technical (yield, selectivity, throughput, catalyst life, safety, operability, reliability); economic (capex, opex, working capital, feedstock exposure, utility cost); strategic (product adjacency, future molecules, backward integration, customer perception, licensing and IP); ESG (carbon footprint, waste, solvent recovery, energy intensity); and organisational (internal expertise, absorption capability, scale-up capability, vendor ecosystem).
How can two IPA routes both be profitable?
Propylene hydration suits producers with integrated propylene and pharma-grade customers. Acetone hydrogenation suits phenol producers who need a home for surplus acetone. Which is more profitable changes with crude, gas, the phenol premium, acetone demand and pharma demand.
Should a later entrant copy the first mover’s route?
Not by default. A first mover usually picks for robustness and speed. A later entrant benefits from toll-manufacturing data, known customer specifications and firmer capex figures, so it can choose a route for differentiation, such as a cleaner impurity profile, even at lower yield.
Can AI select the synthesis route?
AI is strong at screening candidate routes, predicting costs, modelling supply chains and forecasting feedstock prices. It cannot fully predict customer behaviour, regulatory shifts, strategic fit, organisational capability gaps or execution quality. Those still need experienced human judgement.
“The winning route is rarely the route with the highest yield. The winning route is the route that aligns chemistry, strategy, market positioning, organizational capability, and future growth into a coherent competitive advantage.”
All numbers on this page are illustrative and chosen to show direction and relative size, not to value any real asset. The case studies describe industry-level patterns; no company, client or employer information is used. Orissa Engineering provides process engineering, route evaluation and project advisory services.