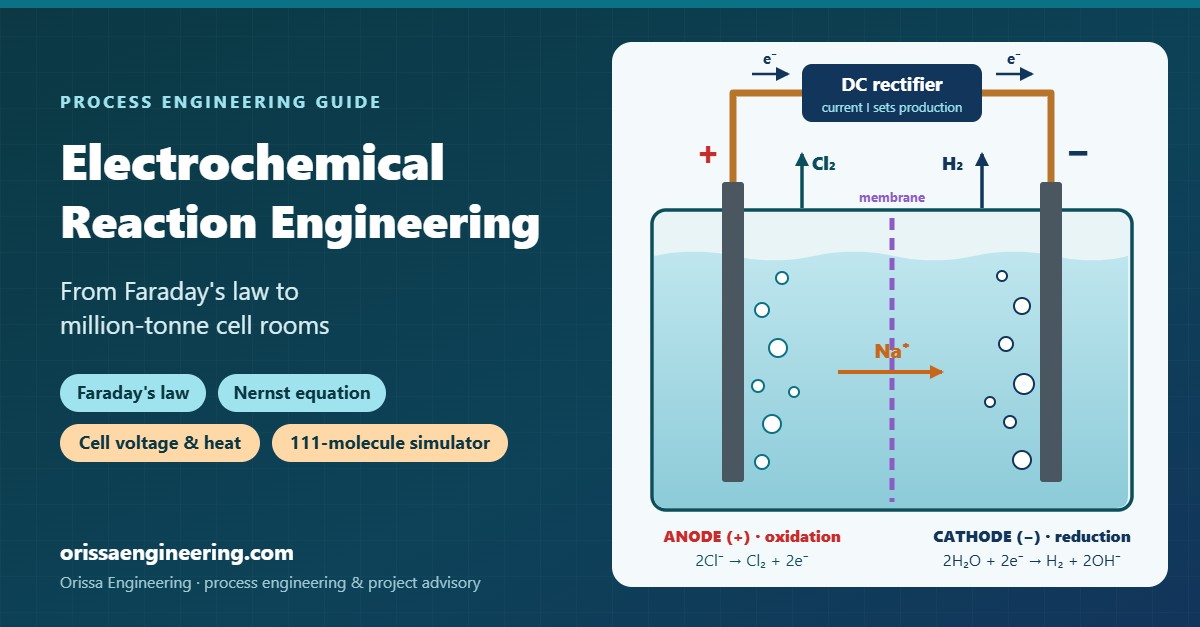
Electrochemical reaction engineering is chemistry driven by electrons, sized with Faraday’s law and paid for in kilowatt-hours. Every can of aluminium, every litre of caustic soda, almost every tonne of copper and most of the world’s zinc starts in an electrolytic cell. This guide covers where electrochemistry runs at million-tonne scale, the fundamentals an engineer actually uses (electrode potential and the Nernst equation, EMF, discharge and decomposition potential, Faraday’s laws, voltage and current density), and then lets you split 111 molecules with current to see the production rate, the voltage you need and the heat you must remove. It ends with the limits that decide what an electrode really makes.
Section 1Electrochemistry at industrial scale
An electrochemical reactor makes a product in proportion to the current you pass through it. That one property, set out in Faraday’s law, explains why electrolysis dominates wherever the product is a reactive element (Al, Na, Mg, Li, Cl2, F2), a high-purity metal (Cu, Zn, Ni, Co) or a strong oxidant (chlorate, persulfate, permanganate) that would be hard to make cleanly any other way. The trade-off is that electricity becomes the largest single cost, so the whole discipline is about the volts per cell and the kilowatt-hours per tonne.
Seven commercial processes that define the field
MetalAluminium: the Hall–Héroult process
- Cell window
- 4.0–4.3 V per pot · 0.8–0.9 A/cm² · 300–600 kA pots · current efficiency 94–96% · 12.5–14 MWh/t Al
- World
- ≈ 74 Mt produced in 2025 against ≈ 79.7 Mt of smelter capacity; China ≈ 45 Mt
- India
- ≈ 4.2 Mt/yr capacity, running close to full, making India the world’s No. 2 producer
- Major producers
- India: Vedanta (Jharsuguda ≈ 1.8 Mtpa; BALCO Korba, expanding towards 1 Mtpa with 525 kA pots), Hindalco (≈ 1.3 Mtpa across Renukoot, Hirakud, Mahan, Aditya), NALCO (Angul ≈ 0.46 Mtpa, expansion under way). World: Chalco, China Hongqiao, Rusal, Rio Tinto, EGA, Alcoa.
ChemicalChlor-alkali: caustic soda, chlorine, hydrogen
- Cell window
- 2.9–3.1 V · 4–7 kA/m² · CE 95–97% · ≈ 2.1–2.3 MWh DC per tonne NaOH
- World
- Caustic soda capacity a little over 100 Mt/yr; China 51.5 Mt (2025); Europe ≈ 11 Mt of chlorine capacity
- India
- 57.85 lakh t/yr (≈ 5.8 Mt) caustic soda capacity (AMAI, March 2025), projected to reach ≈ 8.9 Mt within five years
- Major producers
- India: Grasim / Aditya Birla Chemicals (≈ 1.5 Mtpa, the largest), Gujarat Alkalies & Chemicals, DCM Shriram, Chemplast Sanmar, Meghmani Finechem, Nirma, Reliance. World: Olin, OxyChem, Westlake, Formosa, Xinjiang Zhongtai, INEOS Inovyn, Covestro, Nobian.
EnergyWater electrolysis: green hydrogen
- Cell window
- Alkaline 1.8–2.1 V at 0.2–0.6 A/cm²; PEM 1.8–2.0 V at 1.5–3 A/cm²; ≈ 50–55 kWh/kg H2 at stack level
- World
- Installed capacity passed 4 GW in 2025 (it doubled that year, led by large projects in China); more than 2.5 GW under construction
- India
- National Green Hydrogen Mission (SIGHT) has awarded 8.62 lakh t/yr of green-hydrogen production and 3,000 MW/yr of electrolyser manufacturing capacity; most of the projects are still being built
- Major players
- India: Reliance, Adani New Industries, L&T Electrolysers, Ohmium, John Cockerill Greenko, Avaada. World: LONGi Hydrogen, PERIC, Sungrow, thyssenkrupp nucera, Nel, Siemens Energy, ITM Power.
MetalCopper electrorefining & electrowinning
- Cell window
- Refining 0.25–0.35 V at 250–350 A/m² (≈ 0.3 MWh/t); electrowinning 1.9–2.2 V (≈ 2 MWh/t); copper foil drums run at 20× these current densities
- World
- ≈ 29 Mt refined copper in 2025; about one-sixth comes from SX–EW (solvent extraction + electrowinning)
- India
- ≈ 0.62 Mt refined copper in 2025, up 19% as the new Adani smelter ramped up
- Major producers
- India: Hindalco Birla Copper (Dahej, ≈ 0.5 Mtpa), Adani Kutch Copper (Mundra, 0.5 Mtpa first phase, started 2025), Vedanta (Silvassa refinery; Tuticorin smelter shut since 2018), Hindustan Copper. World: Jiangxi Copper, Codelco, Tongling, Aurubis, Freeport, Glencore.
MetalZinc electrowinning
- Cell window
- 3.2–3.5 V · 400–600 A/m² · CE 88–93% · ≈ 3.0–3.3 MWh/t Zn
- World
- ≈ 13.8 Mt refined zinc in 2025; roughly nine-tenths is made by roast–leach–electrowin
- India
- Hindustan Zinc (Vedanta) is effectively the whole primary industry: ≈ 1.1 Mt/yr refined zinc + lead (FY26 guidance 1.075 Mt) at Chanderiya, Dariba and Debari, with plans to double
- Major producers
- World: Korea Zinc, Glencore, Nyrstar, Boliden, Teck, Zhuzhou Smelter.
ChemicalSodium chlorate for pulp bleaching
- Cell window
- 3.0–3.2 V · 2–3 kA/m² · CE 93–95% · ≈ 5.0–5.5 MWh/t NaClO3
- World
- Of the order of 3.5–4 Mt/yr (estimate), mostly converted to ClO2 at pulp mills; Canada is the largest exporter
- India
- Small domestic output; India imported ≈ 16 kt in 2021 (US EPA supply-chain profile)
- Major producers
- Nouryon, ERCO Worldwide, Kemira and Chinese producers.
SpecialtyFluorine & NF3 from anhydrous HF
- Cell window
- 8–12 V · 0.07–0.15 A/cm² · CE 90–95% · ≈ 13–16 MWh/t F2; theoretical decomposition voltage only ≈ 2.9 V
- World
- F2 is made only electrolytically; the largest outlets are UF6 for nuclear fuel, NF3 and F2 for semiconductor and display fabs, SF6 and specialty fluorination
- India
- Captive, small-scale F2 generation; no merchant-scale NF3 plant yet, so new fabs such as Tata Electronics’ Dholera fab start on imported gases
- Major producers
- UF6: Orano, ConverDyn/Honeywell, Cameco, Rosatom. NF3/F2: SK specialty, Hyosung Chemical, Kanto Denka, PERIC.
Other commercial electrochemical processes
All of these are in the simulator below:
Sources: USGS Mineral Commodity Summaries 2026 (aluminium, copper, zinc), IEA Global Hydrogen Review, AMAI, Euro Chlor, company reports and press releases; see the reference list at the end. Capacities are rounded and change every quarter, so treat them as orders of magnitude.
Section 2Fundamentals an engineer actually uses
2.1 What happens inside an electrolytic cell
An electrolytic cell forces a reaction that would not run on its own (ΔG > 0). A DC rectifier pulls electrons out of the anode, where species are oxidised, and pushes them into the cathode, where species are reduced. Inside the cell the circuit is closed by ions moving through the electrolyte, and a separator (membrane or diaphragm) keeps the anode and cathode products apart. Get the separator wrong and Cl2 meets H2, or F2 meets H2.
2.2 Electrode potential and the Nernst equation: how voltage changes with concentration
Each half-reaction has an electrode potential, the potential at which it is at equilibrium, measured against the standard hydrogen electrode (SHE = 0 V). The standard electrode potential E° is that value at unit activity (1 mol/L for ions, 1 bar for gases, pure solids and liquids), at 25 °C; the activity series in Section 6 is just these values sorted. Real cells never run at unit activity. Chlor-alkali anolyte is 3.5–5.3 M chloride at pH 2–4, the catholyte is 32% NaOH, copper tankhouses carry 35–50 g/L Cu²⁺, electrolysers run at 1–30 bar and 60–960 °C. The Nernst equation converts E° into the actual equilibrium potential at those conditions:
Three rules of thumb follow directly, and they are the ones an engineer uses:
- 59/n mV per decade. At 25 °C, every tenfold change in the concentration of the reacting ion shifts the potential by 59/n mV (about 70/n mV at 80 °C). A metal ion with n = 2 (Cu²⁺, Zn²⁺, Ni²⁺) moves only about 30 mV per decade; chlorine evolution moves 59 mV per decade of chloride, because two Cl⁻ ions take part.
- −59 mV per pH unit for the oxygen and hydrogen electrodes. The same water-splitting anode sits at +1.23 V in acid and +0.40 V in 1 M alkali. That is why the O2/Cl2 competition in brine, and the H2/metal competition in electrowinning, both depend on pH.
- Gas pressure enters as a logarithm. Pressurising a water electrolyser to 30 bar at 80 °C raises the reversible voltage by (RT/2F)·ln(pH₂·pO₂½) ≈ 78 mV, still far cheaper than compressing the hydrogen afterwards.
Nernst shifts are tens of millivolts, small next to overpotentials of hundreds of millivolts, but they decide selectivity (which ion discharges first), they set the minimum voltage in dilute or depleted electrolytes, and at a 300 kt/yr scale every 10 mV is about 2 GWh a year. The concentration overpotential in Section 5.2 is the same equation applied to the gap between surface and bulk concentration while current flows.
| Plant situation | Electrode reaction | What changes | Nernst shift |
|---|---|---|---|
| Copper tankhouse: electrolyte depleted before bleed | Cu²⁺ + 2e⁻ → Cu | Cu²⁺ falls from 50 to 5 g/L (10×) at 45 °C | −32 mV (cathode less noble, closer to H2 and impurity co-deposition) |
| Chlor-alkali: brine depleted in the anolyte | 2Cl⁻ → Cl2 + 2e⁻ | NaCl falls from 310 to 200 g/L (5.3 → 3.4 M) at 88 °C | +14 mV on the anode, and more O2 in the chlorine |
| Seawater vs saturated brine | 2Cl⁻ → Cl2 + 2e⁻ | Cl⁻ 0.55 M instead of 5 M at 25 °C | +57 mV: O2 evolution competes much more |
| Acid vs alkaline water electrolysis | O2 + 4H⁺ + 4e⁻ ⇌ 2H2O | pH 0 → pH 14 | 1.23 V → 0.40 V on the anode (cell Erev unchanged, both electrodes shift) |
| Pressurised alkaline electrolyser | 2H2O → 2H2 + O2 | 1 → 30 bar at 80 °C | +78 mV on the cell |
| Zinc electrowinning, spent vs fresh electrolyte | Zn²⁺ + 2e⁻ → Zn | Zn²⁺ from 150 to 50 g/L at 38 °C, acid rising | −15 mV on Zn while H2 becomes easier: the CE drops |
2.3 EMF, discharge potential and decomposition voltage
The EMF of a cell is the difference between its two electrode potentials. For an electrolytic cell it is negative: you must apply at least that much voltage, the reversible (thermodynamic) decomposition voltage, to make the reaction go. It comes straight from the Gibbs energy:
The discharge potential of an ion is the electrode potential at which it actually starts to discharge (deposit as metal or evolve as gas) at a useful rate on a particular electrode: its equilibrium potential plus the overpotential that electrode material demands. The practical decomposition voltage is the cell voltage at which a sustained current first flows, i.e. Erev plus the two discharge overpotentials. For water on platinum it is about 1.7 V, not 1.23 V. Discharge potentials, not E° alone, decide which product you get (Section 6).
2.4 Faraday’s laws: how production is calculated
Faraday’s first law says the amount of substance reacted is proportional to the charge passed; the second says the same charge produces amounts in proportion to M/n (the electrochemical equivalent). Together they are the design equation of every electrolyser:
| Product | n | kg per kAh (at 100% CE) | Worked example |
|---|---|---|---|
| Chlorine, Cl2 | 2 | 1.323 | 100 kA electrolyser → 132 kg/h Cl2 + 149 kg/h NaOH ≈ 3.2 t/day Cl2 |
| Aluminium, Al | 3 | 0.3355 | 400 kA pot at 95% CE → 127.5 kg/h ≈ 3.06 t/day per pot |
| Hydrogen, H2 | 2 | 0.0376 | 1 MW PEM stack at 1.9 V/cell → 526 kA·cells → ≈ 19.6 kg/h ≈ 51 kWh/kg |
| Copper, Cu | 2 | 1.186 | 40 kA electrowinning cell at 92% CE → 43.6 kg/h ≈ 1.05 t/day |
| Zinc, Zn | 2 | 1.220 | 100 kA cell at 90% CE → 110 kg/h ≈ 2.6 t/day |
| Fluorine, F2 | 2 | 0.709 | 6 kA fluorine cell at 92% CE → 3.9 kg/h ≈ 94 kg/day |
| Sodium chlorate, NaClO3 | 6 | 0.662 | 100 kA cell at 94% CE → 62 kg/h ≈ 1.5 t/day (six electrons per molecule makes chlorate power-hungry) |
2.5 The role of voltage and current: rate versus energy
This is the single most useful idea in electrochemical engineering: current sets how much you make; voltage sets how much it costs. Doubling the current doubles production. The voltage does not change the amount; it decides the energy per kilogram:
The cell voltage is a stack of separate losses on top of the thermodynamic minimum. Each one has a different cause and a different fix:
2.6 Current density: the bridge between chemistry and capex
Current density j = I / A (kA/m² or A/cm²) is the current per square metre of electrode. For a fixed production rate the current is fixed by Faraday, so choosing j chooses the electrode area, the number of cells, the size of the cell room and most of the capital cost. But overpotentials and the I·R drop all grow with j, so a higher j means a higher voltage and a bigger power bill. Every industry has settled on its own compromise:
| Process | Typical j | Typical cell voltage | What limits j |
|---|---|---|---|
| Copper electrorefining | 0.25–0.35 kA/m² | 0.25–0.35 V | Cu²⁺ mass transfer, cathode quality (nodules, short circuits) |
| Zinc electrowinning | 0.4–0.6 kA/m² | 3.2–3.5 V | H2 co-evolution, deposit morphology |
| Simons electrochemical fluorination | 0.1–0.2 kA/m² | 5–6 V | Ni anode film, selectivity, safety |
| Fluorine (KF·2HF) | 0.7–1.5 kA/m² | 8–12 V | Anode effect on carbon, heat removal |
| Sodium chlorate | 2–3 kA/m² | 3.0–3.2 V | Gas void fraction in the narrow gap |
| Alkaline water electrolysis | 2–6 kA/m² | 1.8–2.1 V | Bubble resistance, diaphragm IR |
| Membrane chlor-alkali | 4–7 kA/m² | 2.9–3.1 V | Membrane IR and life, power price |
| Hall–Héroult aluminium | 7–9 kA/m² | 4.0–4.3 V | Heat balance of the pot, alumina dissolution |
| Battery copper foil | 5–10 kA/m² | 5–8 V | High flow, narrow gap, Cu²⁺ supply |
| PEM water electrolysis | 15–30 kA/m² | 1.8–2.0 V | Iridium loading, membrane, heat |
The optimum is where one more kA/m² saves as much in annualised capital as it adds in energy. Treating the ohmic slope as linear (V ≈ V0 + r·j), the cost-optimal current density is:
Section 3 · InteractiveSplit a molecule with current
Pick any of 111 molecules and commercial processes, from water and HF to bauxite-derived alumina, CO2 and acrylonitrile. Enter the current through one cell and the simulator applies Faraday’s law to give the production rate at each electrode, then builds the cell voltage from a polarisation model calibrated to typical industrial operation: thermodynamic voltage + anode and cathode activation overpotentials + ohmic drop + concentration overpotential. Change the current density to see the electrode area, the voltage and the heat load move together.
Coloured bands stack the losses on top of Erev. The red dashed line is the thermoneutral voltage: above it, the gap to the curve is heat. The dot is your operating point; the curve bends up as j approaches the limiting current.
Model: V(j) = Erev + ηa(j) + ηc(j) + r·j + ηconc(j), with Butler–Volmer (asinh) activation terms, a linear ohmic resistance and a limiting-current concentration term. Each process is calibrated to pass through a typical industrial voltage at its typical current density. Erev and Etn come from standard Gibbs energies and enthalpies (operating temperature for molten salts and SOEC); values flagged ≈ est. are engineering estimates. Erev is taken at typical operating concentrations; the Nernst calculator shows how concentration, pH and pressure shift it. Gas volumes are at 0 °C, 1 atm (Nm³). Learning tool only, not a design basis.
Quick reference: decomposition voltage and energy of common electrolyses
The same numbers the simulator uses, for the processes people search for most. Erev is the reversible decomposition voltage (ΔG/nF), Etn the thermoneutral voltage (ΔH/nF); the typical cell voltage and current density (kA/m²) are industrial operating points, and the DC energy is per kilogram (or tonne) of the main product at the typical current efficiency.
| Process | Overall reaction | Erev (V) | Etn (V) | Typical cell V @ j | CE | DC energy |
|---|---|---|---|---|---|---|
| H₂O — alkaline water electrolysis (AWE) | H₂O → H₂ + ½ O₂ | 1.18 | 1.48 | 1.95 V @ 4 | 98% | 52.9 kWh/kg H₂ |
| H₂O — PEM water electrolysis | H₂O → H₂ + ½ O₂ | 1.20 | 1.48 | 1.95 V @ 20 | 99% | 52.4 kWh/kg H₂ |
| H₂O — steam electrolysis (SOEC, 800 °C) | H₂O(g) → H₂ + ½ O₂ | 0.95 | 1.29 | 1.3 V @ 6 | 99% | 34.9 kWh/kg H₂ |
| NaCl — chlor-alkali, membrane cell | 2 NaCl + 2 H₂O → Cl₂ + 2 NaOH + H₂ | 2.19 | 2.31 | 3 V @ 6 | 96% | 2,094 kWh/t NaOH |
| HCl — hydrochloric acid electrolysis (diaphragm) | 2 HCl → H₂ + Cl₂ | 1.36 | 1.73 | 2 V @ 4.8 | 98% | 1,543 kWh/t Cl₂ |
| HF — fluorine generation (KF·2HF melt) | 2 HF → H₂ + F₂ | 2.90 ≈ | 3.11 | 9 V @ 1 | 92% | 13.8 kWh/kg F₂ |
| NH₄F·HF — nitrogen trifluoride (NF₃) electrolysis | NH₄F + 2 HF → NF₃ + 3 H₂ | 2.60 ≈ | 2.90 | 6.5 V @ 0.8 | 65% | 22.6 kWh/kg NF₃ |
| NaCl — sodium chlorate | NaCl + 3 H₂O → NaClO₃ + 3 H₂ | 1.44 | 1.59 | 3.1 V @ 2.5 | 94% | 4,982 kWh/t NaClO₃ |
| Al₂O₃ — aluminium, Hall–Héroult (carbon anode) | ½ Al₂O₃ + ¾ C → Al + ¾ CO₂ | 1.18 | 2.13 | 4.1 V @ 8 | 95% | 12.9 kWh/kg Al |
| NaCl — sodium metal, Downs cell | NaCl → Na + ½ Cl₂ | 3.44 | 4.26 | 6.8 V @ 8 | 88% | 9,008 kWh/t Na |
| MgCl₂ — magnesium metal | MgCl₂ → Mg + Cl₂ | 2.49 | 3.32 | 5.5 V @ 5 | 85% | 14.3 kWh/kg Mg |
| CuSO₄ — Cu electrowinning | CuSO₄ + H₂O → Cu + H₂SO₄ + ½ O₂ | 0.89 | 1.15 | 2 V @ 0.3 | 92% | 1,834 kWh/t Cu |
| ZnSO₄ — Zn electrowinning | ZnSO₄ + H₂O → Zn + H₂SO₄ + ½ O₂ | 1.99 | 2.28 | 3.4 V @ 0.5 | 90% | 3,097 kWh/t Zn |
| Cu anode — copper electrorefining | Cu (impure anode) → Cu (pure cathode) | 0.00 | 0.00 | 0.3 V @ 0.32 | 96% | 264 kWh/t Cu (cathode) |
| MnSO₄ — electrolytic manganese dioxide (EMD) | MnSO₄ + 2 H₂O → MnO₂ + H₂SO₄ + H₂ | 1.22 | 1.41 | 2.5 V @ 0.08 | 95% | 1,622 kWh/t MnO₂ |
| NH₄HSO₄ — ammonium persulfate | 2 NH₄HSO₄ → (NH₄)₂S₂O₈ + H₂ | 2.01 ≈ | 2.10 | 5.2 V @ 6 | 80% | 1,527 kWh/t (NH₄)₂S₂O₈ |
| Acrylonitrile — adiponitrile (Baizer/Monsanto) | 2 CH₂=CHCN + H₂O → NC(CH₂)₄CN + ½ O₂ | 1.20 ≈ | 1.30 | 3.8 V @ 2 | 88% | 2,140 kWh/t Adiponitrile |
| CO₂ — CO by low-temperature electrolysis | CO₂ → CO + ½ O₂ | 1.33 | 1.47 | 3 V @ 2 | 90% | 6,379 kWh/t CO |
≈ marks estimated thermodynamic values. Values are typical, not design data; use the simulator above to change current, current density and efficiency.
Section 4Scale-up: voltage, current density and heat
The three charts below follow whatever you selected in the simulator.
4.1 Two ways to make more product
Production is fixed by current, so scaling up always means more amperes. You can push those amperes through the same electrodes, which raises the current density, or you can add electrode area (bigger cells, more cells) and keep j constant. The first route is cheap in capital and expensive in power, and it eventually hits the limiting current. The second keeps the voltage and energy per tonne constant but grows the cell room in proportion. Industrial scale-up nearly always takes the second route: proven j, gap, flow and temperature are kept, and capacity is added as area.
Starting point = your simulator settings. Teal: fixed electrode area, so j rises with production. Amber: fixed current density, so area rises with production.
4.2 Where the heat comes from
Electrical energy that is not stored as reaction enthalpy turns into heat. The thermoneutral voltage Etn is the dividing line: at Vcell = Etn the cell is heat-neutral; above it, the cell must be cooled; below it (possible only between Erev and Etn, as in solid-oxide cells) heat must be supplied. Current that goes into side reactions (1 − CE) also ends up as heat.
Electrical input = j × V. As j rises, the heat band grows faster than production because the cell voltage climbs above Etn.
4.3 Choosing the current density: the economic optimum
For the production rate you set in the simulator (current × cells), the chart sums the annual power bill (rises with j, because voltage rises) and the annualised cost of electrodes and cells (falls with j, because less area is needed). The lowest point is the economic current density. The default cell cost is back-calculated so that today’s industrial j is the optimum at ₹6/kWh; change the power price or the cost per m² to see why cheap-power regions run hotter cells and why expensive PEM stacks run at 2 A/cm².
Section 5Limitations: polarisation and preferential electrodes
Faraday’s law tells you what you could make. Polarisation and selectivity decide what you actually make, and at what voltage. Every loss in the voltage stack has a physical cause, and each one becomes the limiting factor at some point in scale-up.
5.1 Activation polarisation
Electron transfer across the electrode–electrolyte interface has its own activation energy. Driving it faster needs extra potential, the activation overpotential, which follows the Tafel equation:
5.2 Concentration polarisation and the limiting current
The reacting ion has to diffuse through a thin boundary layer (δ ≈ 10–500 µm) to reach the electrode. When the surface concentration falls towards zero, the current cannot rise further: this is the limiting current density.
Close to jL the voltage climbs steeply and the excess current goes into whatever reaction is next in line: H2 in electrowinning, O2 in a chlorine cell, oxygen and HF oxidation in fluorine cells. The current efficiency collapses. In the simulator, push j past 90% of jL and watch the polarisation curve turn upwards.
5.3 Ohmic polarisation and gas bubbles
The I·R drop comes from the electrolyte gap, the separator, the electrodes and the contacts. Gas bubbles make it worse: they block part of the electrolyte, and the effective conductivity falls roughly as κ(1 − ε)1.5 for a void fraction ε. That is why modern cells use zero-gap designs (electrodes pressed against the membrane), perforated or louvred electrodes that let gas escape to the back, forced circulation and higher temperature. In molten-salt cells the anode–cathode distance is a balance between IR drop (wants small) and metal re-oxidation (wants large).
5.4 Preferential electrode reactions: why the electrode material decides the product
At each electrode several reactions compete. The one that wins is not simply the one with the most favourable E°; it is the one with the most favourable discharge potential, E plus the overpotential on that electrode material at that current density. Engineers exploit this deliberately:
| Electrode material | Approx. H2 overpotential at ≈ 10 mA/cm² | Used where |
|---|---|---|
| Platinised Pt, Pt-group | ≈ 0.02–0.05 V | PEM cathodes, reference electrodes |
| Activated nickel (Raney, NiMo, NiS) | ≈ 0.1–0.3 V | Chlor-alkali and alkaline electrolyser cathodes |
| Iron / mild steel | ≈ 0.3–0.4 V | Chlorate and fluorine cell cathodes |
| Graphite / carbon | ≈ 0.4–0.6 V | HCl electrolysis, many molten-salt cells |
| Zinc | ≈ 0.7–0.8 V | Lets zinc deposit from acid instead of H2 |
| Lead, cadmium | ≈ 1.0–1.1 V | Cathodes for organic reductions (adiponitrile, succinic, glyoxylic acid) |
| Mercury | ≈ 1.1 V + | Historical chlor-alkali: Na⁺ discharges as amalgam instead of H2 |
The same logic applies at the anode. RuO2-based DSA coatings evolve chlorine at very low overpotential but oxygen at a much higher one, so concentrated brine gives > 97% Cl2. Smooth platinum at high current density and low temperature does the opposite of a good oxygen catalyst, and that is what lets sulfate be oxidised to persulfate. Change the electrode and you change the product.
5.5 Side reactions, back reactions and current efficiency
- Back reactions: dissolved aluminium is re-oxidised by CO2 in the bath (2 Al + 3 CO2 → Al2O3 + 3 CO), costing 4–6% CE; hypochlorite is reduced at chlorate cathodes unless dichromate forms a protective film.
- Parasitic reactions: O2 in chlorine, H2 in zinc electrowinning (the “zinc burning” caused by ppb-level Ge, Sb, Co, Ni), CO2/CF4 during an aluminium anode effect.
- Shunt (bypass) currents through common manifolds in bipolar stacks, and electronic leakage through cell bodies and supports.
- Anode effect and passivation: in fluorine and aluminium cells a gas film suddenly blankets the carbon anode; the voltage jumps to 20–50 V until it is broken.
- Degradation: coating wear, membrane fouling by Ca/Mg/Si/Fe impurities, catalyst dissolution under start–stop operation. This is why brine purification to ppb levels and protective polarisation during shutdowns are part of the process, not extras.
Section 6 · InteractiveThe electrochemical activity series: what actually gets produced
The activity (electrochemical) series sorts half-reactions by their standard reduction potential. Read it with two rules: at the cathode, the species with the most positive reduction potential is reduced first; at the anode, the species whose oxidation needs the least positive potential is oxidised first. Then correct for concentration (Nernst) and for the overpotential on the real electrode. The ladder shows E° for the couples that matter industrially; the tool below applies both corrections to real electrolytes.
Standard reduction potentials vs SHE at 25 °C (rounded). Teal = more positive (easily reduced, strong oxidants); amber = more negative (hard to reduce, reactive metals that need molten salts).
Section 7How an electrolysis plant is engineered
Turning a half-reaction into a 100,000 t/yr plant follows a sequence that is the same for chlorine, hydrogen, fluorine or zinc. Skipping a step is how projects end up with cells that work in the lab and fail in the cell room.
- Chemistry and thermodynamics. Write both half-reactions, n, Erev, Etn and every competing reaction at the real concentrations, pH and temperature. Decide whether a separator is needed and which ion should carry the current.
- Electrode and separator selection. Pick catalysts for the wanted reaction and against the unwanted one (DSA, IrO2, activated Ni, Pb, carbon, BDD), and a membrane or diaphragm that survives the chemistry: perfluorinated membranes for Cl2/NaOH, Zirfon for alkaline water, none for chlorate.
- Polarisation data and current density. Measure V–j curves and current efficiency in a flow cell that reproduces the gap, velocity and temperature of the full-scale cell. Choose j from the cost optimum (Section 4.3), with margin below jL.
- Cell and stack design. Monopolar or bipolar (Figure 3), electrode gap, flow distribution, gas disengagement, current-collector design and uniform current distribution. Scale-up rule: keep j, gap, velocity and temperature constant and add area.
- Electrical system. Transformer–rectifier sets (thyristor or IGBT, 12- to 48-pulse) at 97–98% efficiency, harmonic filtering, DC busbars sized for millivolt drops at every joint, the maximum circuit voltage (often 1–1.6 kV DC) that fixes cells per rectifier, earthing and stray-current control.
- Heat and mass balance. Q = I(V − CE·Etn) per cell, electrolyte circulation and concentration control, water balance, coolers or heaters, purge streams for impurities.
- Gas handling and safety. Keep H2 in Cl2 and O2 in H2 far below explosive limits, pressure-balance the separator, design for F2/HF/Cl2 release scenarios, hazardous-area classification and HAZOP.
- Materials of construction. Titanium on the wet chlorine side, nickel for hot caustic, Monel and nickel for HF/F2, PVDF/PTFE linings, refractory and carbon for molten salts.
- Controls and instrumentation. Individual cell-voltage monitoring (the best early warning of membrane, electrode or short-circuit problems), current, temperature, pH and concentration; protective polarisation during shutdowns.
- Economics and operations. Power is usually 50–70% of the cash cost, so the power contract, rectifier efficiency, recoating and membrane-replacement cycles and plant uptime decide competitiveness as much as the chemistry does.
Section 8Working on an electrochemical process? Let’s engineer it together
Custom solutions for electrochemical processes
I am a process engineer specialising in fluorine and fluorine specialty chemicals, electrochemical reactions, flow reactions, nitric acid and capital project execution. If you are developing, scaling up or troubleshooting an electrochemical process, I can help you turn a half-reaction into a working, bankable plant:
- Technology and route selection, feasibility and techno-economics
- Cell, electrolyser and stack sizing: j, V, area, cell count, rectifier and busbars
- Heat and mass balances, cooling and electrolyte circuits
- Lab-to-pilot-to-plant scale-up, including flow electrochemistry
- Fluorine / HF electrolysis and electrochemical fluorination
- Chlor-alkali, chlorate, persulfate, hypochlorite and salt splitting
- Electrowinning, electrorefining and plating lines
- Troubleshooting high cell voltage, low current efficiency, short electrode or membrane life
- Safety studies for H2, Cl2, F2 and HF systems (HAZOP, layout, materials)
- Owner’s engineering, technical bid analysis and execution support
Share the chemistry, the scale (kA, t/day or MW) and the problem you are solving. Confidentiality agreements are welcome before any data is exchanged.
Frequently asked questions
What is the difference between decomposition voltage and discharge potential?
Discharge potential belongs to one electrode: the potential at which a particular ion starts to discharge at a useful rate on a particular material (equilibrium potential + overpotential). Decomposition voltage belongs to the whole cell: the minimum voltage at which sustained electrolysis begins. Thermodynamically it is ΔG/nF; in practice it is that value plus both discharge overpotentials.
How do you calculate the production rate of an electrolytic cell?
Use Faraday’s law: m = I·t·M/(n·F) × CE. A shortcut: each kAh delivers 37.31 mol of electrons, so kg per kAh = 0.03731·M/n. Multiply by the current in kA, the number of cells in series and the current efficiency.
Why is the real cell voltage so much higher than the thermodynamic voltage?
Because the reversible voltage applies at zero current. At industrial current densities you add activation overpotentials at both electrodes, the ohmic drop through electrolyte, bubbles, separator and hardware, and concentration overpotential near the limiting current. In chlor-alkali this adds ≈ 0.8 V to 2.19 V; in fluorine cells it adds ≈ 6 V to 2.9 V.
How much heat does an electrolyser generate?
Q = I·(Vcell − CE·Etn) per cell, where Etn = ΔH/nF is the thermoneutral voltage. A 400 kA aluminium pot at 4.1 V releases roughly 0.8 MW of heat, about half its input; a membrane chlor-alkali cell releases about a quarter of its input as heat.
How does concentration change the electrode potential (Nernst equation)?
E = E° − (RT/nF)·ln(aRed/aOx). At 25 °C each tenfold change in the concentration of the reacting ion shifts the potential by 59/n mV: about 30 mV for Cu²⁺/Cu, 59 mV per decade of chloride for chlorine evolution, and −59 mV per pH unit for the oxygen and hydrogen electrodes. Pressurising an alkaline electrolyser to 30 bar at 80 °C raises its reversible voltage by about 78 mV.
What current density should I design for?
The one that minimises power cost plus annualised cell cost, kept safely below the limiting current: j* ≈ √(c / (r·h·p)). Use the optimisation chart in Section 4 for your process, then confirm with pilot polarisation data.
“In an electrolysis plant, chemistry decides what is possible, Faraday decides how much you make, and every tenth of a volt decides whether you make money.”
Related engineering guides
- From natural gas to syngas: steam methane reforming, the thermal route that electrolytic hydrogen competes with
- Packed-bed scrubber sizing tool for Cl2, HF and acid-gas vents from cell rooms
- Process control philosophy for interlocks, cell-voltage monitoring and safe shutdowns
- Route of synthesis selection: when an electrochemical route beats a thermal one
- Technical bid analysis for comparing electrolyser and rectifier offers
- Critical path in chemical plant execution, from paperwork to first batch
References and data sources
- U.S. Geological Survey, Mineral Commodity Summaries 2026: Aluminum, Copper, Zinc (world and India production and capacity, 2025 estimates).
- International Aluminium Institute data via Mysteel (2025 primary aluminium ≈ 73.8 Mt) and AlCircle reporting on Vedanta FY2025 output (Jharsuguda 1.83 Mt, BALCO 0.59 Mt).
- Alkali Manufacturers Association of India (AMAI), March 2025: India caustic soda capacity 57.85 lakh t, projected 89.26 lakh t; Grasim Industries Integrated Annual Report 2025–26 (caustic soda capacity 1,505 kt/yr).
- Euro Chlor, industry data (≈ 11 Mt member chlorine capacity, 2025); Blooming / SunSirs: China caustic soda capacity 51.51 Mt (2025).
- IEA, Global Hydrogen Review 2026, production chapter (installed electrolysis > 4 GW in 2025, > 2.5 GW under construction); Ministry of New and Renewable Energy statement, March 2026 (SIGHT awards: 3,000 MW electrolyser manufacturing, 8.62 lakh t/yr green hydrogen).
- ICSG and USGS copper data; S&P Global on Adani Kutch Copper start-up (June 2025); BigMint/ICSG on India’s 19% rise in refined copper output (2025).
- ILZSG via Kitco (2025 zinc market); Business Standard on Hindustan Zinc FY26 guidance (1,075 kt refined metal).
- US EPA, Sodium Chlorate Supply Chain Profile (2023) for trade data.
- Standard electrode potentials and thermochemical data: CRC Handbook of Chemistry and Physics; NBS Tables of Chemical Thermodynamic Properties. Process operating windows: Ullmann’s Encyclopedia of Industrial Chemistry; Pletcher & Walsh, Industrial Electrochemistry; Grjotheim & Kvande, Introduction to Aluminium Electrolysis.
All capacities are public figures rounded for readability and change frequently. Cell voltages, current densities and efficiencies are typical ranges from the open literature, not data from any company or client. Orissa Engineering provides process engineering, electrochemical process design and project advisory services.